

The most important contemporary phenomenon for our politics and, perhaps, for the future of our country is the ongoing sorting of our citizens into red and blue states. The dynamic is pretty simple: people are leaving blue states for red states, with the single exception of those whose first priority is lavish welfare benefits, who therefore seek out blue states. This might seem like a terrible deal for the blue states, and of course it is, in the long term.
But meanwhile, things are not all bad for Democratic politicians. They are getting rid of a lot of pesky businessmen and others who tend to vote against them, and are replacing those exiles with welfare-dependent voters who have little choice but to support the party that is writing them checks. Even the dullest-witted Democratic politician can chart the rate of his state’s decline against his own schedule for retirement. At that point, who cares? Apres moi, as someone once said, le deluge.
There are two data sources on movement of people from state to state. The Census Bureau releases the raw numbers each year, but with little information about who is going where. The IRS data are much more informative–they tell you the age of the people moving and the income of the household’s main taxpayer. So you can tell who is moving from place to place. Unfortunately, the IRS releases data more sporadically, not necessarily every year. Happily, it has just put out its data for the year 2023; that is, the people who moved between 2022 and 2023.
The Committee to Unleash Prosperity has compiled the numbers:
Here are some of the initial findings. These charts show the 10 states that gained and lost the most net income from domestic migration from 2022 to 2023. Red and purple states are gobbling up money from high tax blue states.
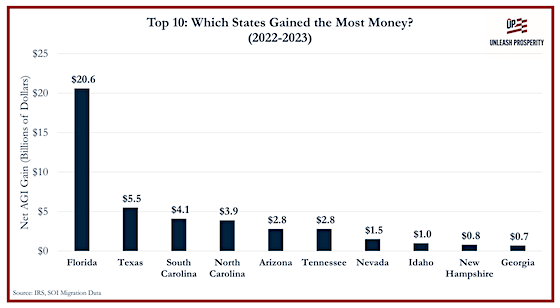
No surprises there: Florida dominates, and no state with higher than average taxes is attracting desirable domestic immigrants. Next, the biggest losers:
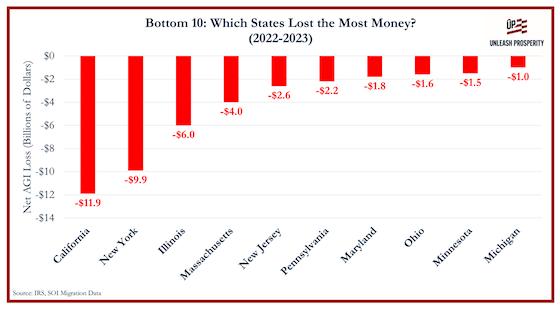
Again, no surprises. High-tax states are collapsing before our eyes, and, of course, it is the states with the most population that lose the most net income.
However, I would point out one anomaly: the awful performance of Minnesota. Minnesota lost $1.5 billion of income in 2023, almost the same as Ohio. But Ohio has more than twice Minnesota’s population. Likewise, Minnesota lost one and one half times the net income of Michigan, but Michigan’s population, too, is close to double that of Minnesota. So on a per capita basis, only Maryland shares the basement with Minnesota. Per capita, even the disaster that is Gavin Newsom’s California rates only slightly worse than Minnesota.
Maybe someone will tell Minnesota voters about this between now and the Fall.