
Accusations about gerrymandering are in the news, but this is actually something that can be studied objectively. American Experiment economist John Phelan developed a methodology to measure how much a state is, or is not, gerrymandered. He explains:
First, we take the Democratic party’s vote share in each state. Second, we take the share of each state’s seats won by the Democratic party. Third, we subtract the latter from the former to get the percentage point difference between the share of votes cast for Democrats and the share of seats won by them. Fourth, we convert the negative values — where the deviation is in favor of the Republicans — to positive values and divide all the percentage point scores by ten. This gives us our inaugural American Experiment Index of Gerrymandering, with scores ranging from 0.0 for the least gerrymandered to 4.9 for the most. Sixth, we remove all thirteen states with either one or two seats in the House of Representatives — six of which deviate towards the Democrats and seven towards Republicans — because, in the first instance, these delegations cannot be divided, and, in the second, they cannot be divided whilst respecting the majority principle.
So: 0.0 is not gerrymandered at all, while 4.9 is the maximum possible gerrymander. The results are shown in this chart:
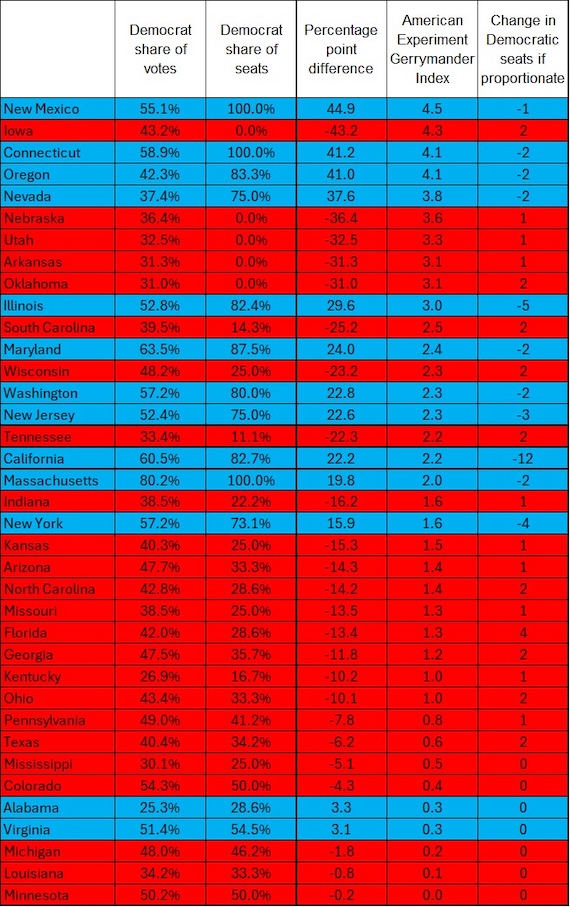
So the most gerrymandered state is New Mexico, while the least–not at all–is Minnesota. Maybe it’s a relic of the state’s good government days. As you would expect, Democrats are the kings of gerrymandering:
[O]f the 37 states remaining, thirteen deviate towards the Democrats (highlighted in blue) and 24 towards the Republicans (in red). But we also see that the average index of deviations towards Democrats is 2.5 compared to just 1.6 for those towards Republicans. In short, when Democratic states gerrymander, they do it more aggressively than Republican ones. Indeed, if we apply the actual vote shares won by Democrats in each state in 2024 to the number of seats each state has, the Democrats would gain 31 House seats in states like Iowa and Nebraska but lose 37 in states like California and New York for a net loss of six seats in the House of Representatives.
So, if representation in Congress were exactly proportional to votes cast for Congressional candidates, the Republicans would gain six seats in the House.
Case closed.